How to Write a Scientific Figure Legend That Stands Alone
Draft a figure legend that explains panels, samples, units, symbols, and uncertainty, using a clearly labeled illustrative example.
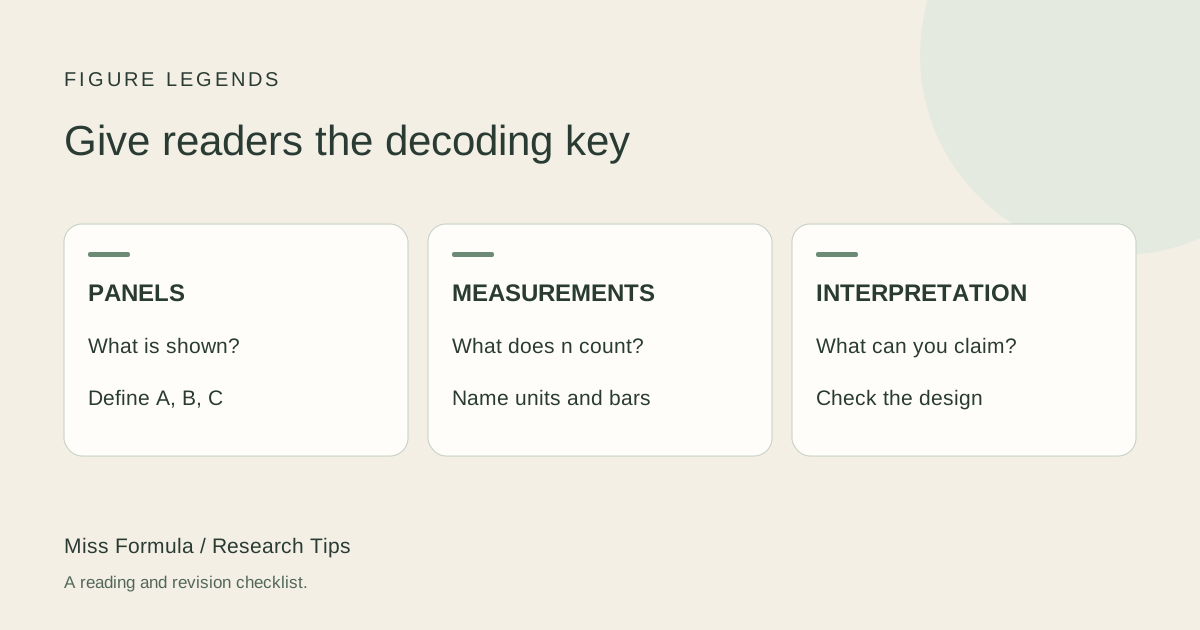
Give readers enough information to interpret the figure
A useful scientific figure legend identifies what is shown, explains each panel, defines the visual encodings, and supplies the information needed to interpret the measurements. Start with a short descriptive title, then describe panels in order. Add sample definitions, units, error-bar meanings, and relevant analysis details where needed.
PLOS One’s figure guidance asks authors to make figures understandable without referring back to the text, describe multipart panels, and define non-standard symbols and abbreviations. Its specific caption formatting rules belong to that journal. Always check your own journal’s instructions before submission.
A standalone legend should help the reader decode the figure. It should not repeat an entire methods section or make a stronger causal claim than the design supports.
Draft the legend in five parts
| Part | Question to answer | Example wording |
|---|---|---|
| Title | What is being shown? | Response measurements after 24 hours of exposure. |
| Panel descriptions | What does each panel contain? | (A) Experimental timeline. (B) Response measurements. |
| Sample and unit | What does each point represent? | Each point represents one independent culture; response is in arbitrary units. |
| Visual definitions | What do lines, colors, and bars mean? | Horizontal lines show means; bars show standard deviations. |
| Analysis or scope | What comparison was tested, or was none tested? | Descriptive illustration only; no inferential test was performed. |
Use the actual design and analysis in place of these example phrases. If a scale bar appears, state its length and unit. If an asterisk indicates a test result, identify the comparison and define its threshold or reported value as required by your journal.
Repair a legend that leaves the reader guessing
Illustrative dataset, not experimental evidence. Imagine panel A is a 24-hour timeline. Panel B shows three independent culture measurements per group: control 8, 10, 12 and exposure 10, 12, 14 arbitrary units. Each point is one culture. The group means are 10 and 12; each sample standard deviation is 2.
Incomplete: “Figure 1. Exposure improves response. Data are mean ± error.” The title implies a conclusion that has not been tested, “error” has no defined meaning, and the number and type of observations are absent.
Revised illustrative legend: “Figure 1. Response measurements after 24 hours of exposure. (A) Timeline from group assignment to measurement. (B) Measurements for control and exposure groups, shown in arbitrary units. Each point represents one independent culture; n = 3 cultures per group. Horizontal lines indicate group means, and error bars indicate ±1 sample standard deviation. Values are illustrative; no inferential statistical test was performed.”
The revised version tells readers how to read the image and labels the example’s limits. For a real figure, substitute the actual sample definition, measurements, analysis, and units; remove the illustrative-data statement only when you are describing real data.
Define uncertainty instead of writing “error”
Nature Communications’ statistical guidance asks authors to label measures of center and variability, report sample sizes, and state whether a value following ± is a standard deviation or standard error. Apply your journal’s reporting rules to both the figure and its caption.
A standard deviation describes spread among observations. A standard error describes uncertainty in an estimated mean under the relevant assumptions. A confidence interval has its own interpretation and confidence level. These labels cannot be swapped just to make bars smaller. Keep the analysis script or source workbook available so the plotted values can be checked.
If your points are repeated measurements from the same biological sample, explain the relationship. Three wells from one preparation should not silently become three independent biological replicates. State what n counts, and describe any aggregation used for plotting.
Audit the exported figure and legend together
- Read only the image and legend. Identify the groups, outcome, units, and time point without consulting the main text.
- Match every panel and symbol. Check that letters, colors, line styles, scale bars, and abbreviations are described consistently.
- Trace the statistics. Confirm the number and type of observations and the meaning of bars against the source analysis.
- Remove unsupported conclusions. A descriptive difference is not automatically an established treatment effect.
- Reopen the final export. Look for cropped panel labels, displaced symbols, and a caption referring to an earlier panel order.
Use AI Writer to revise the wording while keeping numerical details fixed. For editable layouts, use Editable Figure Maker in Miss Formula Studio; its drawing capabilities are also available on Miss Formula’s dedicated EditableFigure.com site. For the broader file review, follow the scientific figure submission checklist.
Source guidance checked November 18, 2026. Follow the current instructions of your target journal or review protocol.
AI Writer
Draft and revise your figure legend. Verify results against your original sources.