A Scientific Figure Checklist Before Journal Submission
Run a figure review from source data through export, with a worked example for a three-panel manuscript figure.
Write down the submission specification
For each figure, record the destination, acceptable format, final width, resolution for raster artwork, and any font or legend rule. Pick the target size before checking readability. For example, PLOS One provides its own size, format, and resolution specifications. Use the instructions for your journal and article type. The ICMJE recommendations also call for labels that stay legible after reduction.
If a journal requests a raster image at 300 pixels per inch and 3.25 inches wide, the file should be 975 pixels wide at that size. Check both dimensions before uploading. Keep a separate source file for edits.
Walk a three-panel figure from A to C
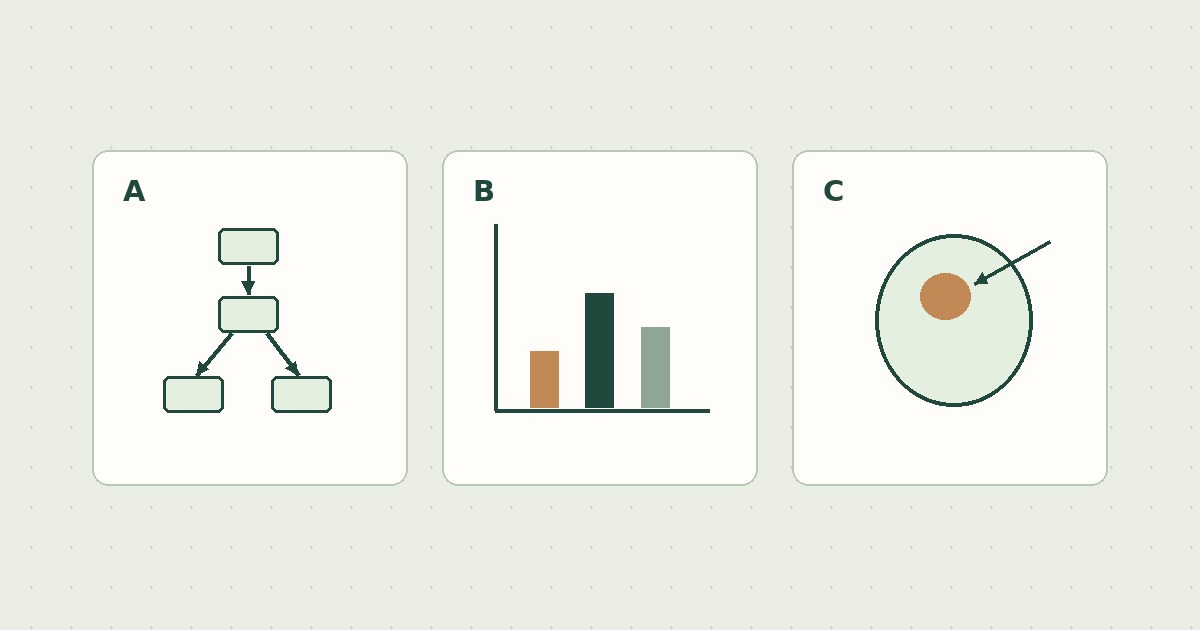
Suppose panel A shows sample selection, panel B plots an outcome, and panel C explains how a measurement was made. Start by reading the legend as a new reader would. Then compare each panel with the protocol, data, or source illustration.
| Panel | Review | Example correction |
|---|---|---|
| A · Selection | Follow both branches and reconcile counts with the methods. | Move excluded records to the side branch instead of leaving them on the analysis path. |
| B · Outcome | Match plotted values, units, group labels, and uncertainty to the underlying data. | Expand “error bars” to state what they represent, using the actual analysis. |
| C · Measurement | Confirm scale, orientation, and every arrow or symbol. | Replace an ambiguous arrow label with the operation it represents. |
Ask a second reader to describe what changed between groups and what the figure leaves uncertain. Fix any wording or encodings that lead to a different interpretation from the manuscript.
Keep an editable master and the data together
Keep the chart’s underlying data and plotting instructions, the editable schematic, and any source images in the figure folder. Track permission, credit, and journal disclosure requirements for third-party material or AI-assisted artwork. Retain the original file if you crop or adjust an image, and follow the journal’s image integrity rules.
Editable Figure Maker can help revise labels, arrows, and shapes in a schematic and save an SVG or PowerPoint copy. For quantitative charts, generate the final chart from the data and compare the exported values, scales, and error bars with that source.
Open the file you will submit
- View the export at the journal’s intended size. Check type, symbols, scale markings, and thin lines.
- Compare the file and legend against the editable master. Look for changed fonts, clipped edges, shifted labels, and missing annotations.
- Check the figure number, filename, legend, and first in-text citation. If the submission system creates a proof, inspect it too.
Record the accepted export settings with the master so a coauthor can reproduce the submitted file after a revision.
Editable Figure Maker
Inspect editable labels, shapes, and arrows before exporting a revision.