1. Write the two decisions
Name the condition at each split. Keep an action such as “Assess full text” separate from a question such as “Meets criteria?”
Docs / Scientific diagrams
Write the main path and every decision outcome in plain English. In AI Diagram Generator, choose Standard, generate a draft, and compare every arrow with the procedure before exporting.
This illustrative screening example has two decision points. It shows the structure of a process without implying sample counts or a reporting standard.
Create a top-to-bottom flowchart. Start with “Screen title and abstract,” then go to “Relevant?” If No, go to “Exclude.” If Yes, go to “Assess full text,” then “Meets criteria?” If Yes, go to “Include in review.” If No, go to “Exclude and record reason.” Label each decision arrow Yes or No. Do not add counts or extra steps.
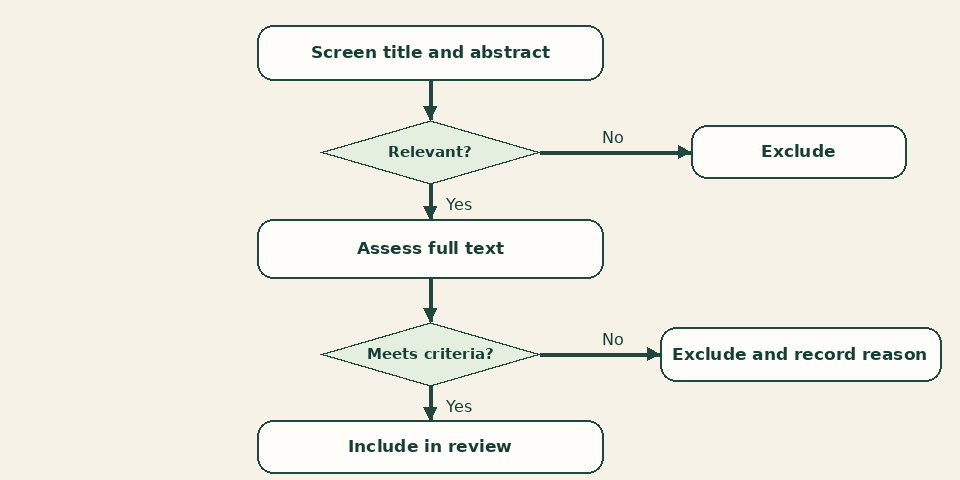
This reference layout shows the intended branches. Your generated layout can vary.
Name the condition at each split. Keep an action such as “Assess full text” separate from a question such as “Meets criteria?”
Open AI Diagram Generator, select Standard, enter the example or your own procedure, and generate a first draft.
Trace a record rejected during the title screen, a record rejected at full text, and one included in the review. Correct any connector that joins the wrong path.
Keep the Draw.io file for coauthor changes. Review a separate presentation or manuscript export at the intended size.
See how to turn a sketch into an editable research diagram, or compare the modes on the AI Diagram Generator page.
Name the condition at each split. Keep an action such as “Assess full text” separate from a question such as “Meets criteria?”
Trace a record rejected during the title screen, a record rejected at full text, and one included in the review. Correct any connector that joins the wrong path.
Use Standard, Hand-drawn, or Mermaid depending on the input and the source you need to maintain.
Update the draft in the appropriate editor after checking its relationships.
Keep an editable version so a coauthor can update it later.
Use an export for sharing after checking readability and connections.
Any data you upload is processed only temporarily. We do not use your data to train our own models.
Academic workflows worldwide
Students, researchers, and educators use Miss Formula to prepare figures, check references, and work with equations for papers, presentations, and teaching materials.
Feedback summaries from Miss Formula users about their work across the platform.
Michael started with a reference figure and opened the generated version in his browser. The layout was already in place, so he could focus on correcting a few labels before moving on with his work.
Carlos brought his figure into PowerPoint for a presentation. Because the shapes and text were still editable, he could change the colors on the slide and keep the panel he had already put together.
YunKai uses the converter on dense mechanism diagrams that go through several rounds of revision. Keeping arrows, labels, and grouped elements editable makes those revisions easier when parts of the diagram need to change.
Anna starts with a description, generates a figure, and edits it in the browser before adding it to her thesis or slides. That sequence fits the way she already prepares figures for her academic work.
James used AI Source Finder to search for papers from a draft written in Chinese. The English queries were better than the keywords he would have entered himself, and he also runs Citation Checker before submitting.
Maya used AI Source Finder to add references to a paragraph in her literature review. She then converted the equations in Miss Formula, which let her handle both steps in the same place.
Questions about this workflow.
Describe the parallel paths explicitly and state where they rejoin. Confirm the draft shows both paths.
Yes. Add the actual counts after generating the structure and reconcile them with the review records.
Use the sketch guide to preserve the layout and check hard-to-read labels.
Turn a written screening procedure into an editable flowchart. Check each decision branch before saving the Draw.io source.
Open AI Diagram Generator