How to Create Editable Scientific Figures with GPT Image 2.6
Draft a scientific figure with GPT Image 2.6, see what its SVG output lets you change, and turn a draft into an editable SVG or PowerPoint in Miss Formula.
What GPT Image 2.6 does well for scientific figures
GPT Image 2.6 can turn a written brief or a rough sketch into a visual draft for a graphical abstract, methods diagram, or conceptual illustration. You can specify how many panels you need, what each one should show, and how arrows should connect them. That gives you a composition to review before you spend time aligning shapes or laying out labels by hand.
OpenAI offers Sunburst for detailed visual work and more consistent edits, and Flare for faster iteration. Use Flare to explore different layouts and Sunburst when placement and visual detail matter. The Image API also supports markup-guided editing. For example, you can circle the part of a draft that needs a different color, then describe the change. OpenAI still flags precise text placement and structured layouts as limitations, so check small labels and arrow directions against your brief. OpenAI release notes · OpenAI markup guide.
Where PNG and direct SVG fall short
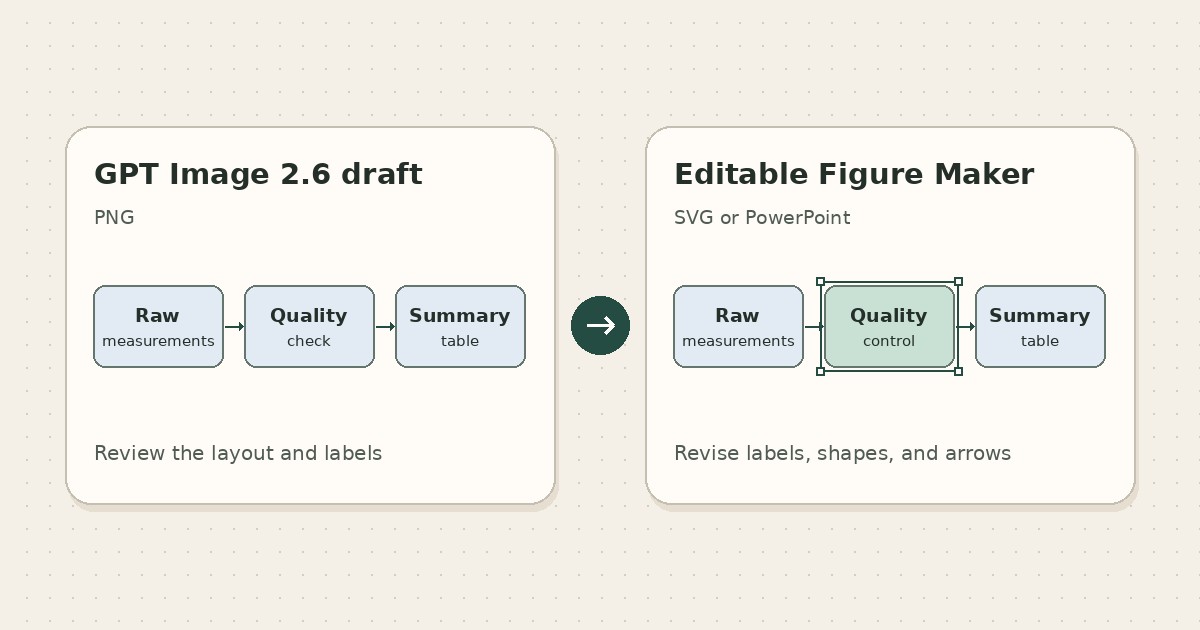
A PNG can look ready for a paper while every label and arrow is still part of the same image. If a coauthor asks you to rename a box or redirect one arrow, a raster edit can redraw nearby details. With an editable figure, you can select the affected element and change it directly.
GPT Image 2.6 can generate a real SVG. OpenAI’s Image API first renders a reference image and then uses it to create static vector artwork. This is useful for scalable illustrations and for editing the vector shapes the file actually contains. The SVG option is available on the documented generation endpoint. The reference-image edit endpoint returns raster output for still-image edits and does not accept SVG as an edit input. OpenAI SVG output documentation.
For a figure that will go through revisions, test the actual objects. A label stored as an SVG <text> element can be retyped. A label drawn as outlines can be reshaped or recolored, and changing its wording requires adding a text object. Try selecting one arrow on its own, too. If it shares a path with another element, you may need to separate or redraw it. A direct SVG is a good fit when it passes the edits you expect to make. MDN’s SVG text reference.
When you have a PNG from GPT Image 2.6, or you need a figure that colleagues can revise in PowerPoint, Miss Formula’s Editable Figure Maker brings generation, image-to-vector conversion, browser editing, and export into one workspace. It reconstructs supported labels, arrows, and shapes as selectable elements. Editable Figure Maker.
Generate and convert a figure in Miss Formula
- In Editable Figure Maker, open Generate and choose Text to Figure, Sketch to Figure, or Ref Figure to Figure. Select GPT Image 2.6 Sunburst. If you already have a PNG or JPG, start at Convert.
- Describe the figure’s layout, exact labels, and arrow directions. Try the prompt below, then compare the draft with your brief.
- Open Convert and provide the draft image. In the editor, change “Quality check” to “Quality control” and select one arrow independently. Compare small text and arrow endpoints with your original brief after conversion.
Create a wide scientific workflow diagram on a white background. Arrange three evenly spaced boxes in one row. Label them “Raw measurements”, “Quality check”, and “Summary table”, in that order. Connect each adjacent pair with one arrow pointing right. Use navy text, pale blue fills, thin outlines, and generous white space. Include only the three labels, three boxes, and two arrows.
Make your own editable figure
Generate with GPT Image 2.6 or convert a draft you already have.
Try editing a scientific figure right here
Use the sample figure in the editor below to try changing a label or moving a shape. You can edit each element separately, just as you can after converting your own figure.
Export and verify the file you’ll share
- SVG for vector editing. Reopen it in your editor and try retyping one label and changing the stroke of one arrow.
- PowerPoint for slide editing. Open the exported file in PowerPoint and try editing a label or moving one box on its own.
Before sharing the figure, check it at its intended size. Verify spelling, units, panel order, and arrow directions against the source material. For data figures, build the plots and statistical annotations from your measured values.